Can we Design a Multi-Stakeholder Approach to Contact Tracing that Can Build Trust?

By | Uncategorized

As the US economy starts to recover from the Global Pandemic’s initial shock; one painful reality is also coming into focus. Racial and socioeconomic disparities correlate with the negative impact of the Coronavirus.

For instance, a recent paper from the annals of epidemiology concludes that “Nearly twenty-two percent of US counties are disproportionately black, and they accounted for 52% of COVID-19 diagnoses and 58% of COVID-19 deaths nationally. County-level comparisons can both inform COVID-19 responses and identify epidemic hot spots. Social conditions, structural racism, and other factors elevate the risk for COVID-19 diagnoses and deaths in black communities”.

As a result of these sociodemographic disparities, the one size fits all approach when dealing with the Coronavirus is not going to be very useful because of the different contexts at the local level. We argue that if we use a multi-stakeholder model to organize the information and visualize the transmission networks, we can enable a micro-targeted approach that can speed up the positive feedback loop of testing, tracing, and isolating. Stakeholder trust will increase as long as we can keep the R (Effective Reproduction Number) below one, which is the threshold needed to keep the epidemic under control.

We propose creating near real-time digital community maps supported by sociodemographic data so that organizations can make informed decisions that lead to more consistent goal achievement and more effective and fair allocation of resources. An example of such a system automatically prioritizes cases containing super-spreaders in populations with a high index of 65 and older individuals living alone and under the poverty line.

Most contact tracing solutions take information about a specific individual with COVID-19 and document all the contacts that the individual came in close contact with over the incubation period, which can be up to 14 days, according to The World Health Organization. The information gathered is then used to identify the chain of transmission and isolate the network of new cases resulting from the primary contact.

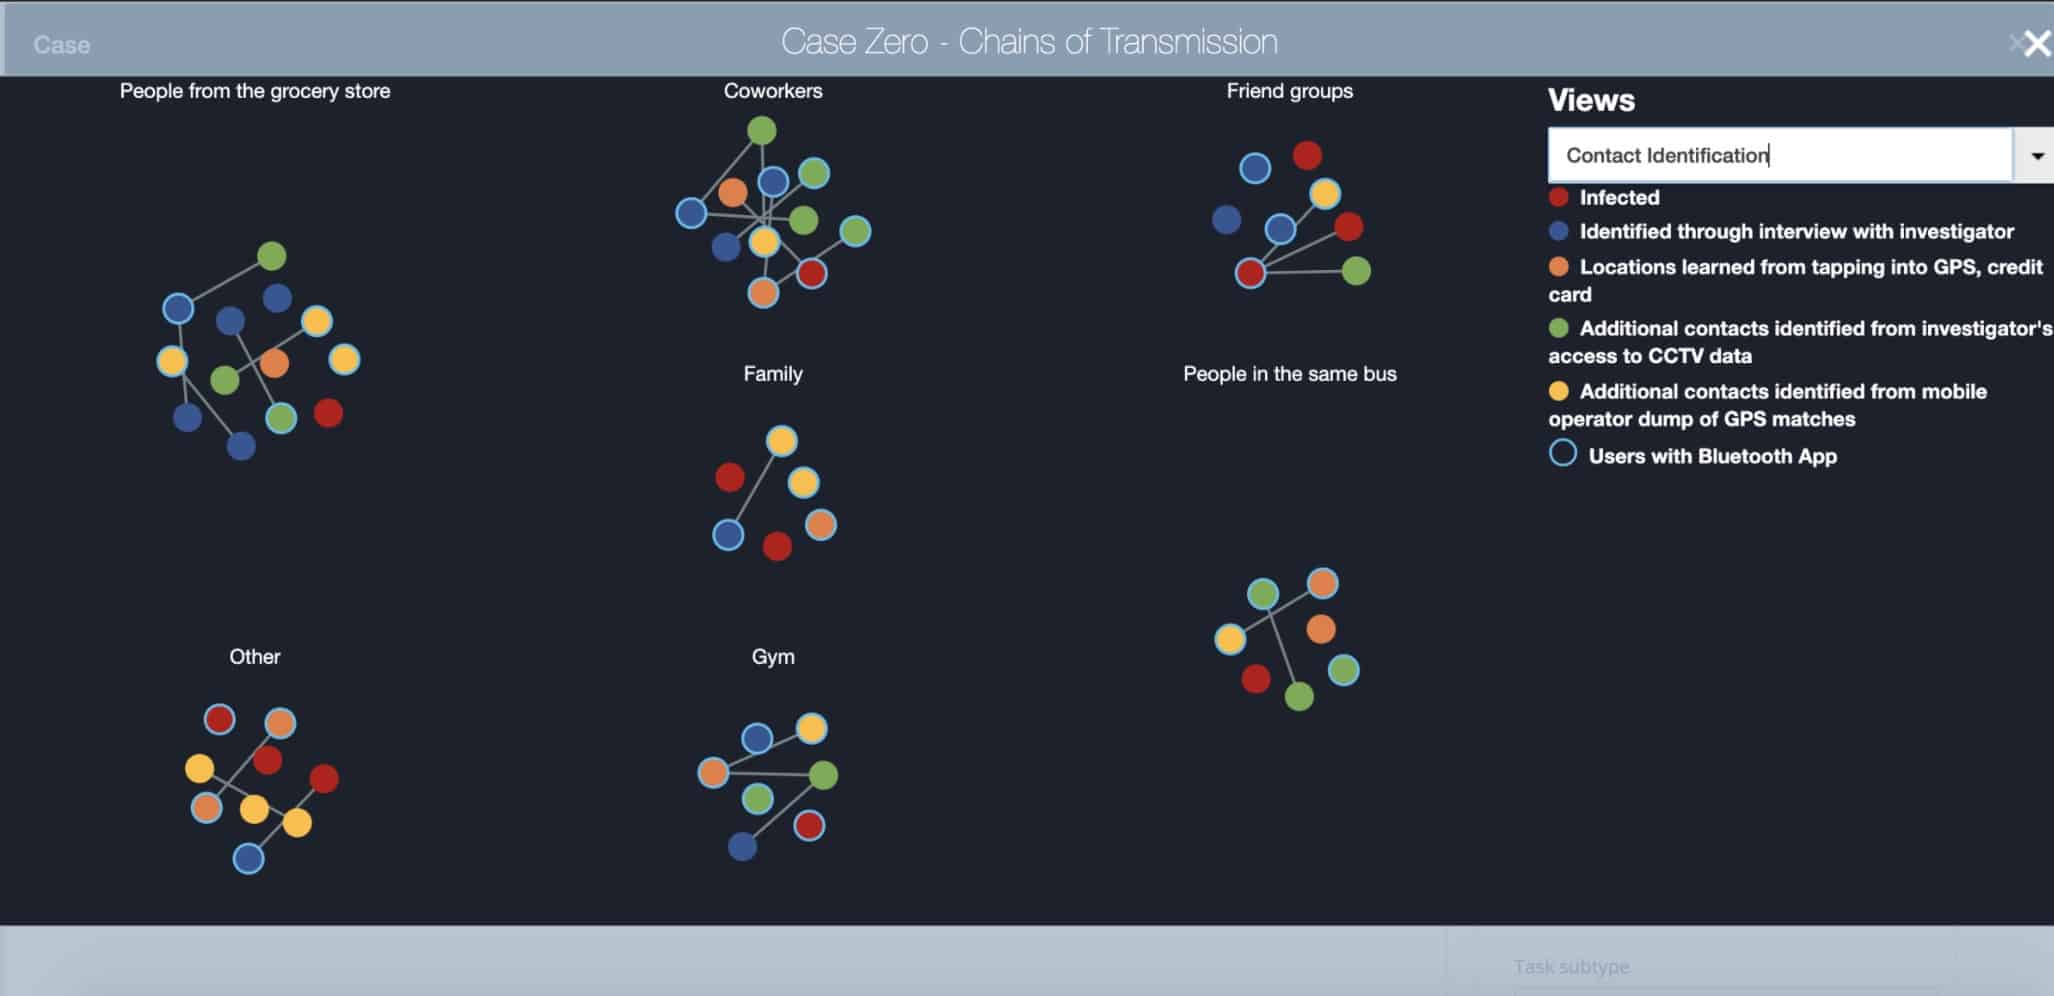
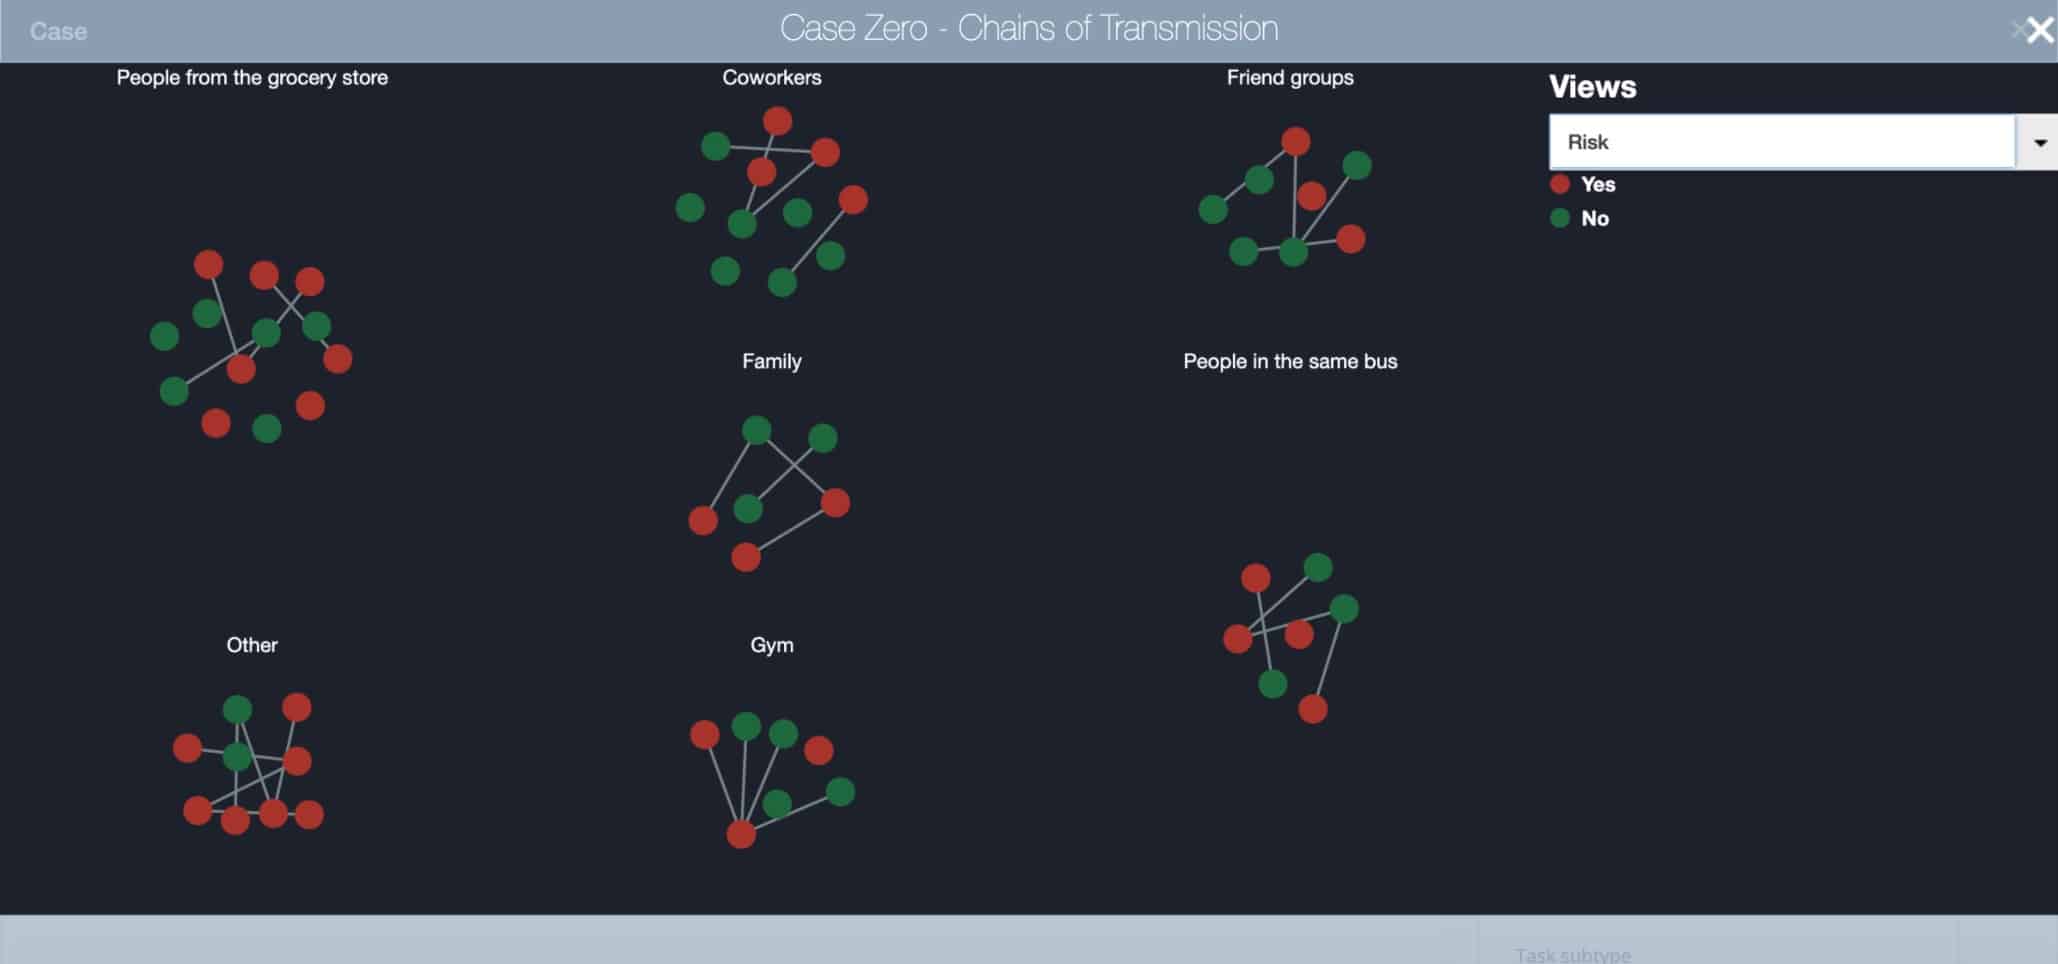
The following image illustrates an example of a Network of Stakeholders associated with a single positive case. We classified Stakeholders by group (e.g., family, coworkers, people at the Gym) and by the form of identification (e.g., using Bluetooth App, direct interview over the phone, by GPS or credit card movements).

Visualization of Chains of Transmission by Type of Identification 

A multi-stakeholder approach would expand the scope of the data collected to include sociodemographic information, and to establish a system for dynamic mapping of organizations, their members, and their corresponding networks of relationships; for example, churches, synagogues, mosques, schools, community centers, museums.

By creating a digital map of the community and the visualization of the relationships, we can identify hotspots faster and get a better understanding of where the spread is happening. The goal is to isolate and prevent a single case from becoming a cluster, and from rapidly escalating to become a mega-cluster that can overwhelm the health and social services available at the local level.

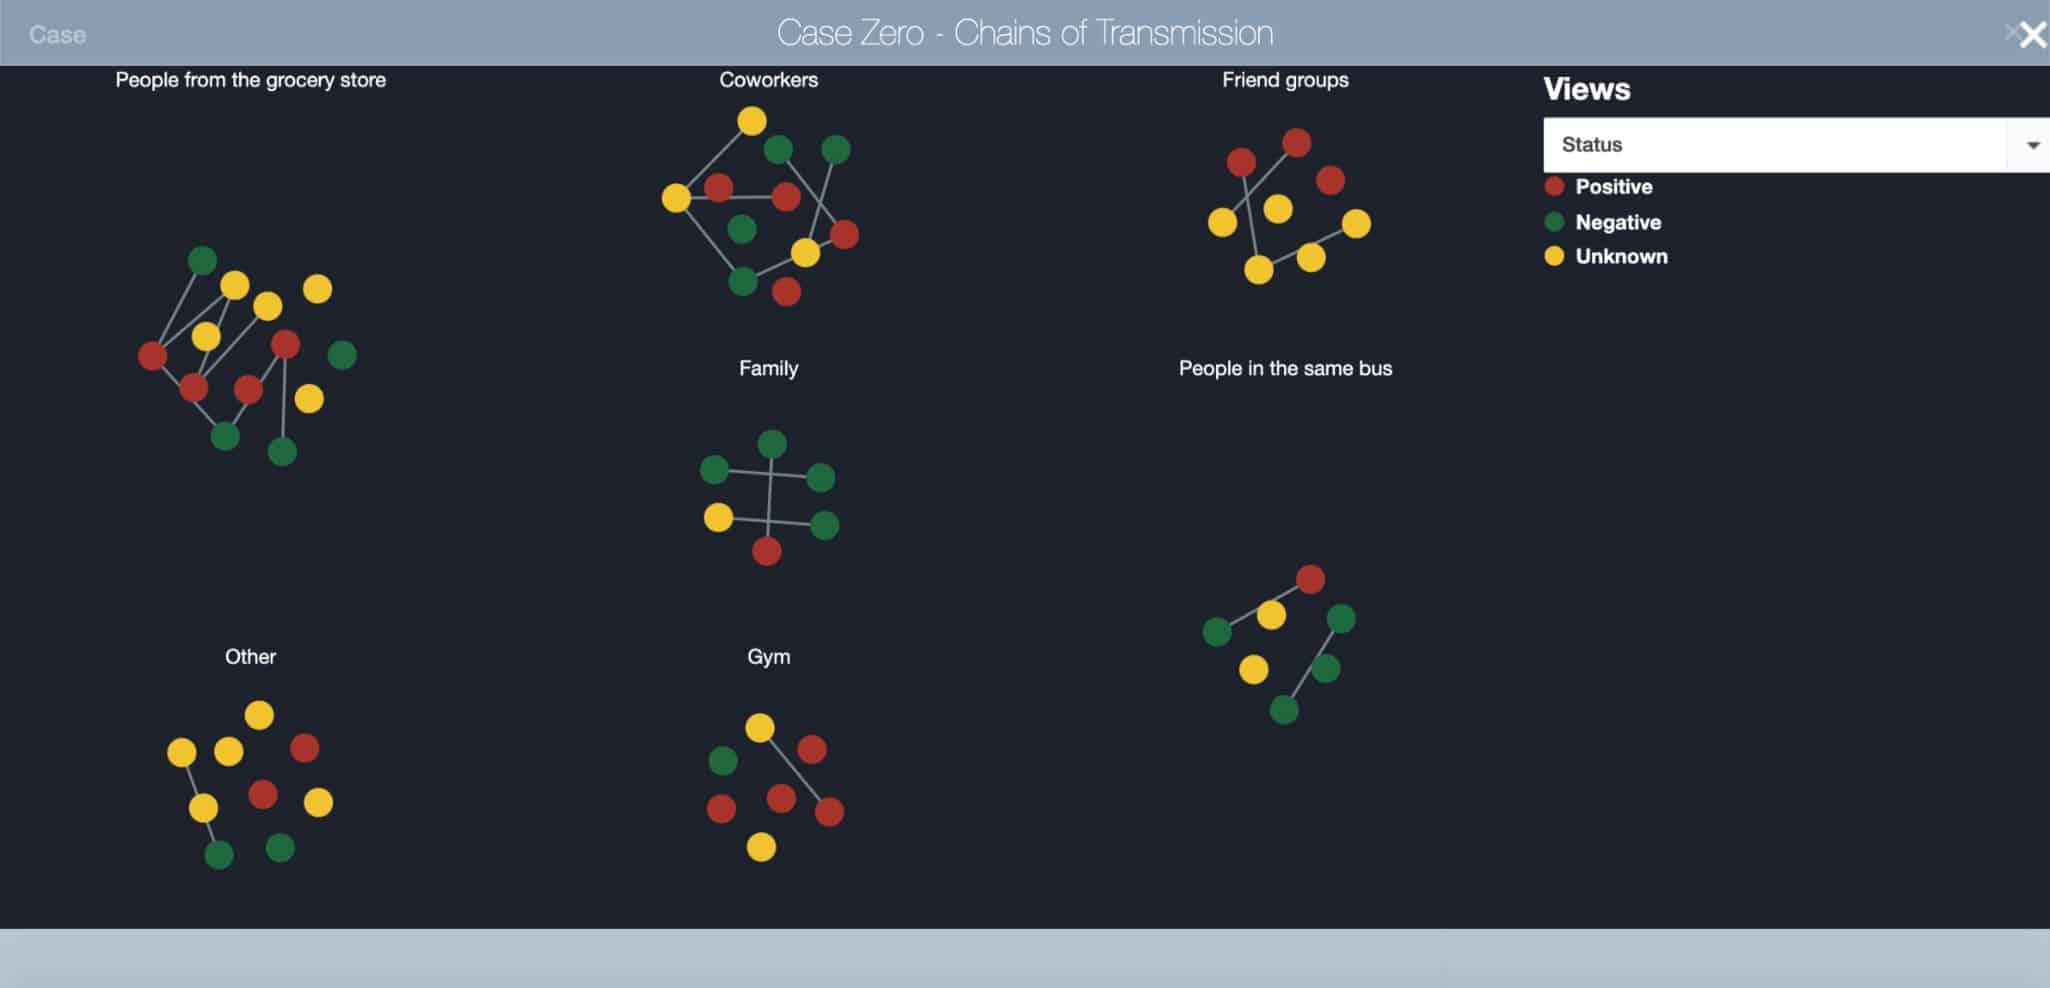
Visualization of Chains of Transmission by Status 

Despite the rapid pace in which the economy seems to be reopening nationwide, still, right now, the virus is showing signs of retaking the lead, as states relax restrictions on large gatherings and welcome customers back into bars, restaurants and movie theaters. Cases are on the rise in more than 23 states across the country, with new highs in Arizona, Texas, and Florida, which tallied 3,822 on June 19th a 19% jump from what had been the record a day earlier, and it’s more than double what had been the record for single-day cases a week ago (1,902). As the level of prevalence increases, the risk of Florida becoming the next hotspot increases as well.

As we will show in the use case below, a multi-stakeholder framework can connect the archipelago of dots between stakeholders’ networks, geospatial, socioeconomic, hospitalizations, and demographic data. The result is a scalable model with a high degree of granularity that can help us understand the myriad of transmission networks.

Use Case: The San Francisco Bay Area

For this example, we will use the data set COVID-19 Vulnerability Index, a database of each county’s risk for severe illness burden due to COVID-19 trends in reported COVID-19 cases and deaths, clinical risk factors, and social and economic determinants. To develop this use case, we used StakeWare’s Stakeholder Relationship Mapping Technology.

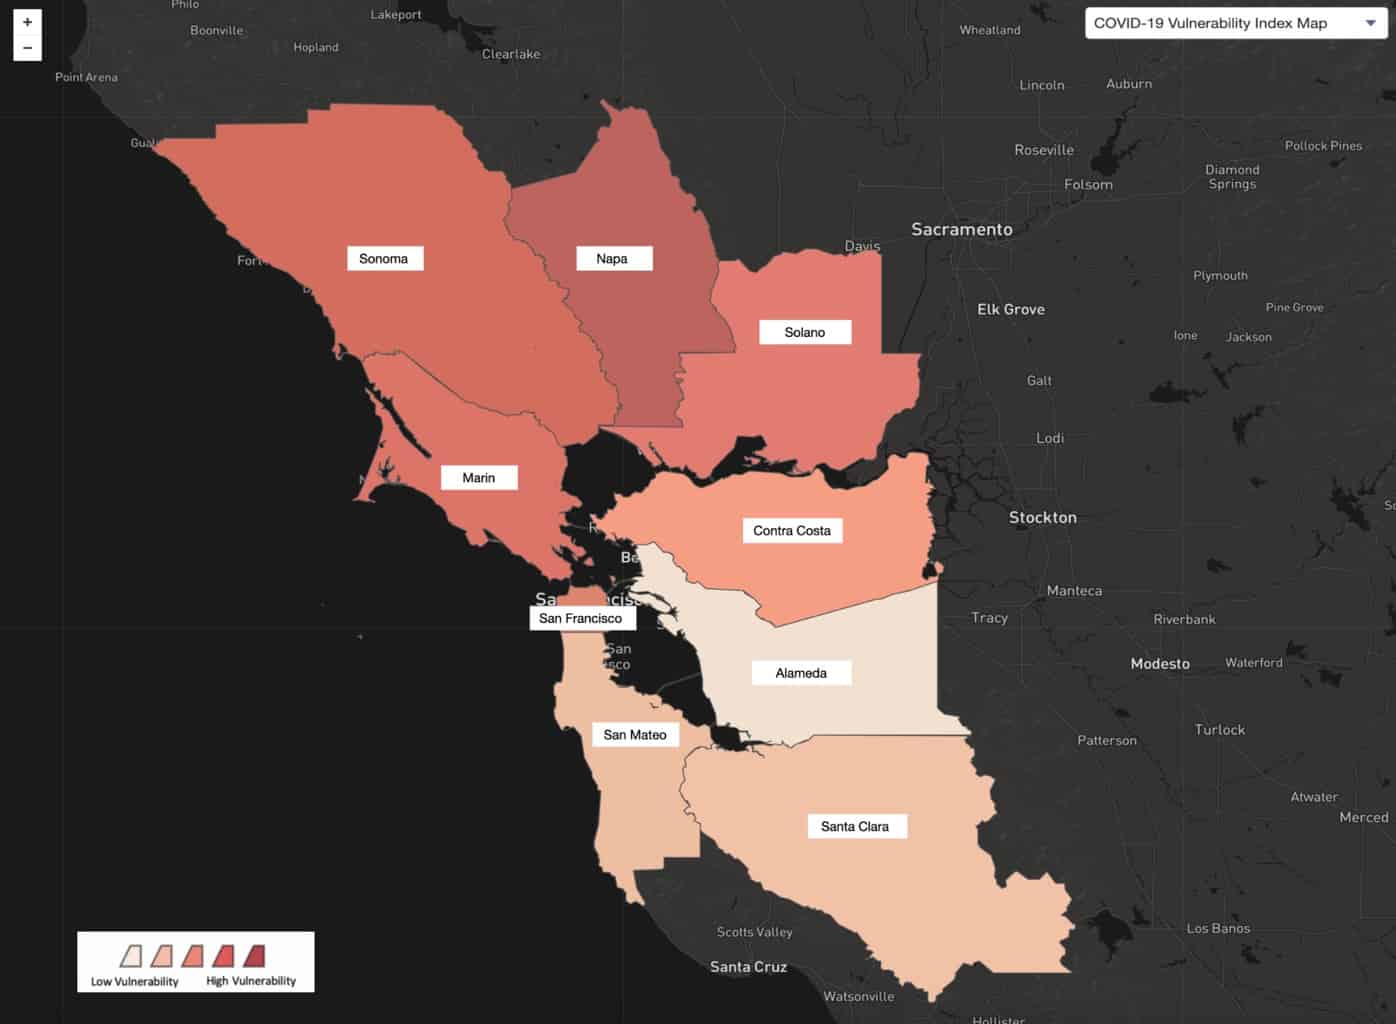
We start by looking at the nine Bay Area Counties and their ranking on the COVID-19 Vulnerability Index. We can see that Napa has the highest vulnerability because it has the darkest color, while Solano, Contra Costa, and Alameda have a lower vulnerability.

Bay Area Counties Ranked by COVID-19 Vulnerability Index

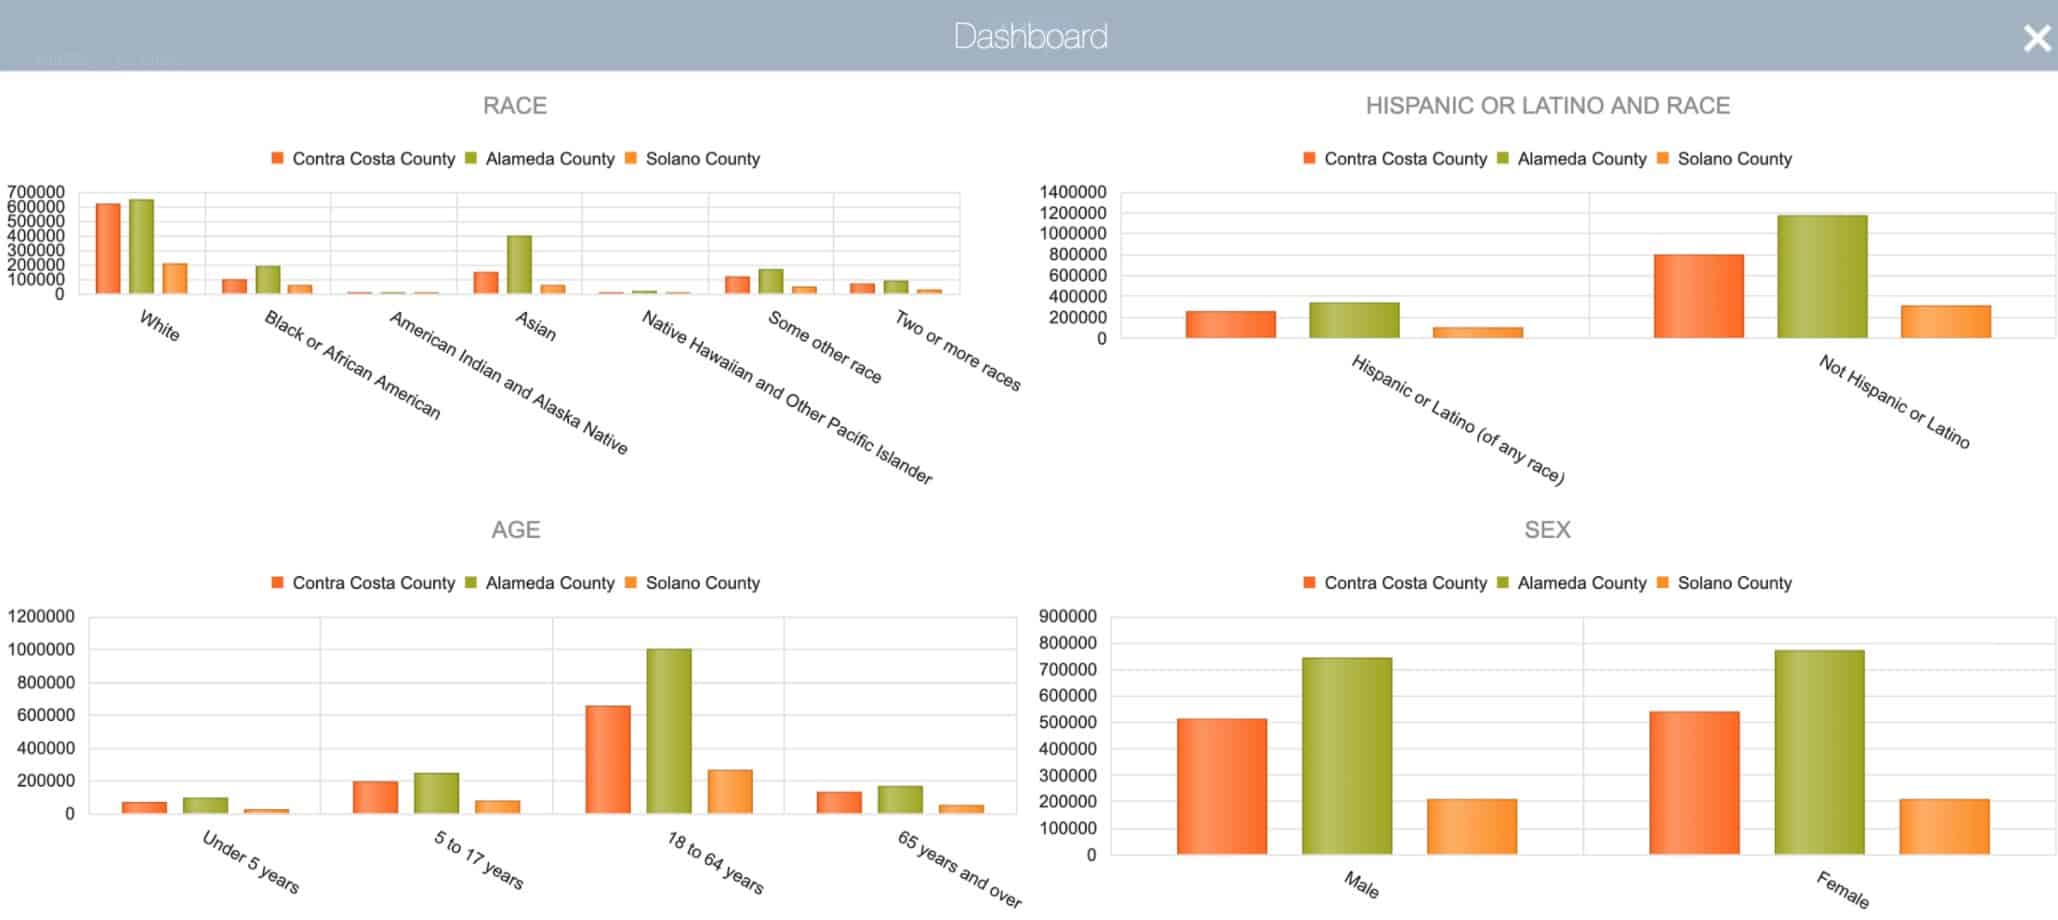
If we focus on Solano, Contra Costa, and Alameda, we can see that Alameda has the lowest vulnerability. But, if we correlate sociodemographic data, we see that Alameda has the highest number of individuals 65 years and older, and the most significant percentage of African American and Latino communities.

Socio-Demographic Data for Contra Costa, Alameda and Solano Counties (Census Data)

Data sets by race and ethnicity are crucial for understanding the extent to which there are disparities in access to and receipt of health and economic relief. For example, take the scenario of one case of a COVID-19 positive stakeholder from Alameda County that goes to Church services in Contra Costa and participates in several community events in Solano County. If we only focus on one set of data, i.e., Vulnerability Index for the county of residence, we can conclude that Alameda is a lower risk. Thus, the case should not be a top priority. Yet, if we consider the vulnerable populations within all the contact points, the impact might be much more significant.

By breaking the silos of the county data and focusing on the relationship mapping and the socioeconomic attributes of each connection, we can get a clearer picture of the optimal path to help stop the spread. This is especially so if we can provide micro-targeted mitigating measures tailored to address specific geospatial and racial disparities.

This scenario may seem far fetched, but let’s not forget the case of the Shincheonji Church in Daegu, a city of about 2.5 million in the southeast of South Korea, where a 61-year-old Shincheonji congregant — known as Patient №31 — infected many other worshipers during services. The Korea Centers for Disease Control and Prevention at some point reported that 63.5 percent of all confirmed cases in the country were “related to Shincheonji.” single case №31. The South Korean model’s success illustrates how their ability to pinpoint Patient №31 is a testament to their systems’ granularity and their capacity to act quickly and proactively.

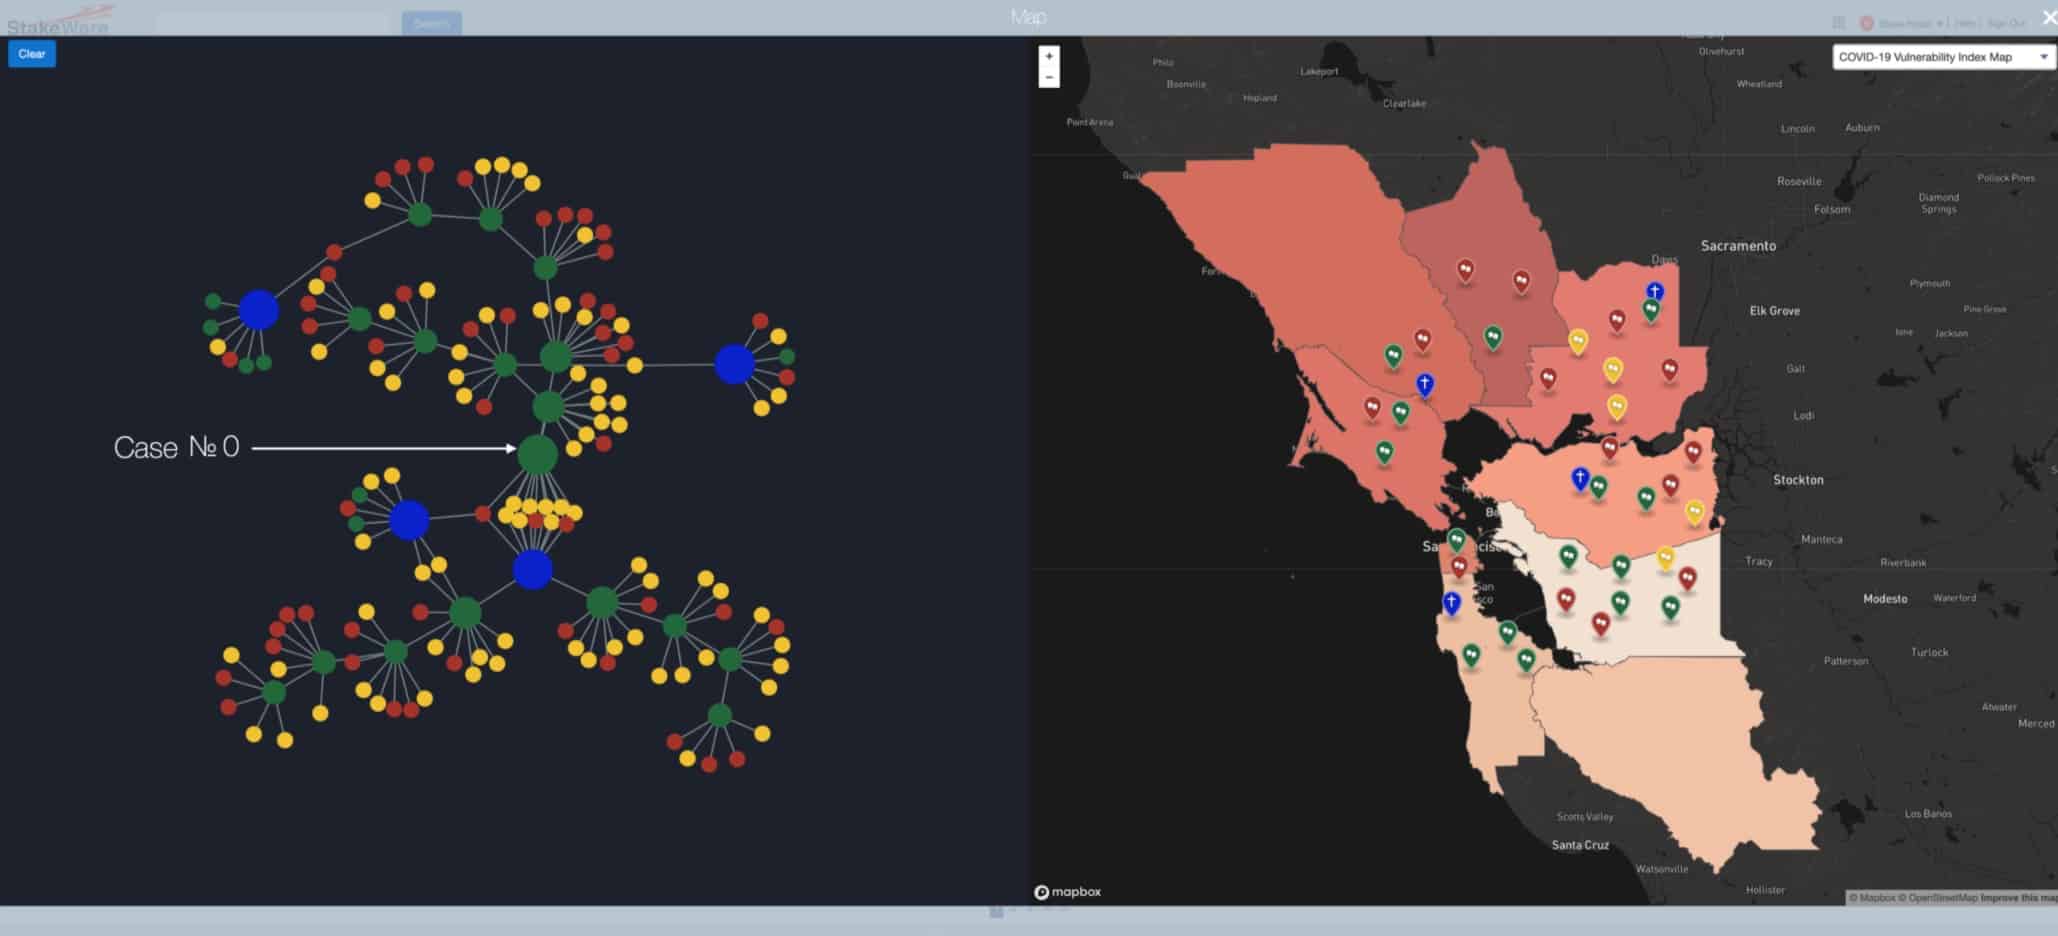
The following dashboard illustrates how the orchestration of three types of data can lead to a more proactive approach. On the left side, we have a network visualization of all the stakeholders associated with an original case (№0). The green dot pointed by the arrow represents the original case. The blue dots represent four different places of worship, and the red and yellow dots are contacts associated with the infected cases. On the right, we have a juxtaposition of the geospatial location of the stakeholders overlaid with different types of sociodemographic indicators.

When we click on the dot on the network of contacts on the left, their respective location will appear on the map on the right.

Integration of Network Analysis with Sociodemographic and Geospatial Data

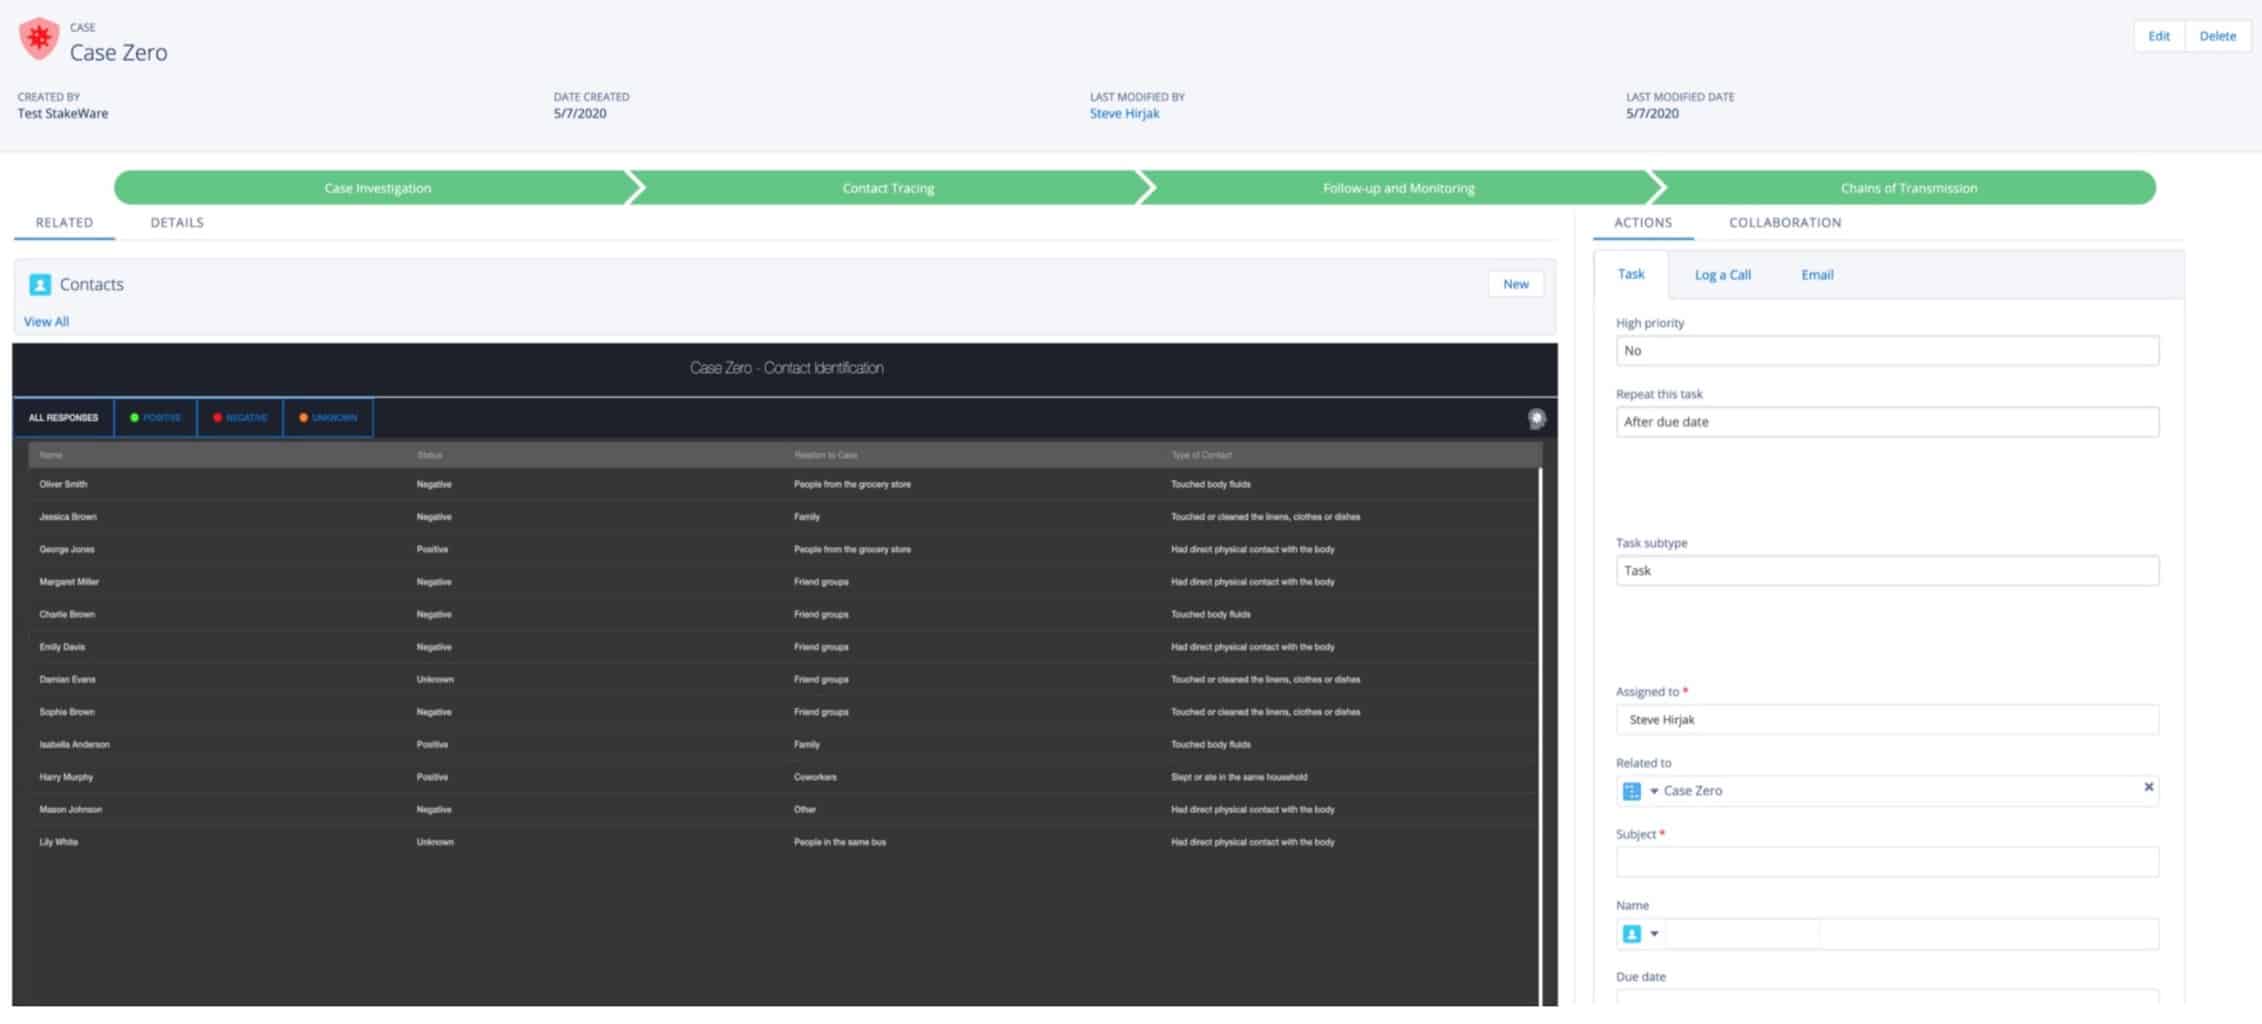
When we click on one of the green dots, we can access all the details of their case, from the case investigations to the contact traced and the chains of transmissions identified.

360 Degree View of Case № 0

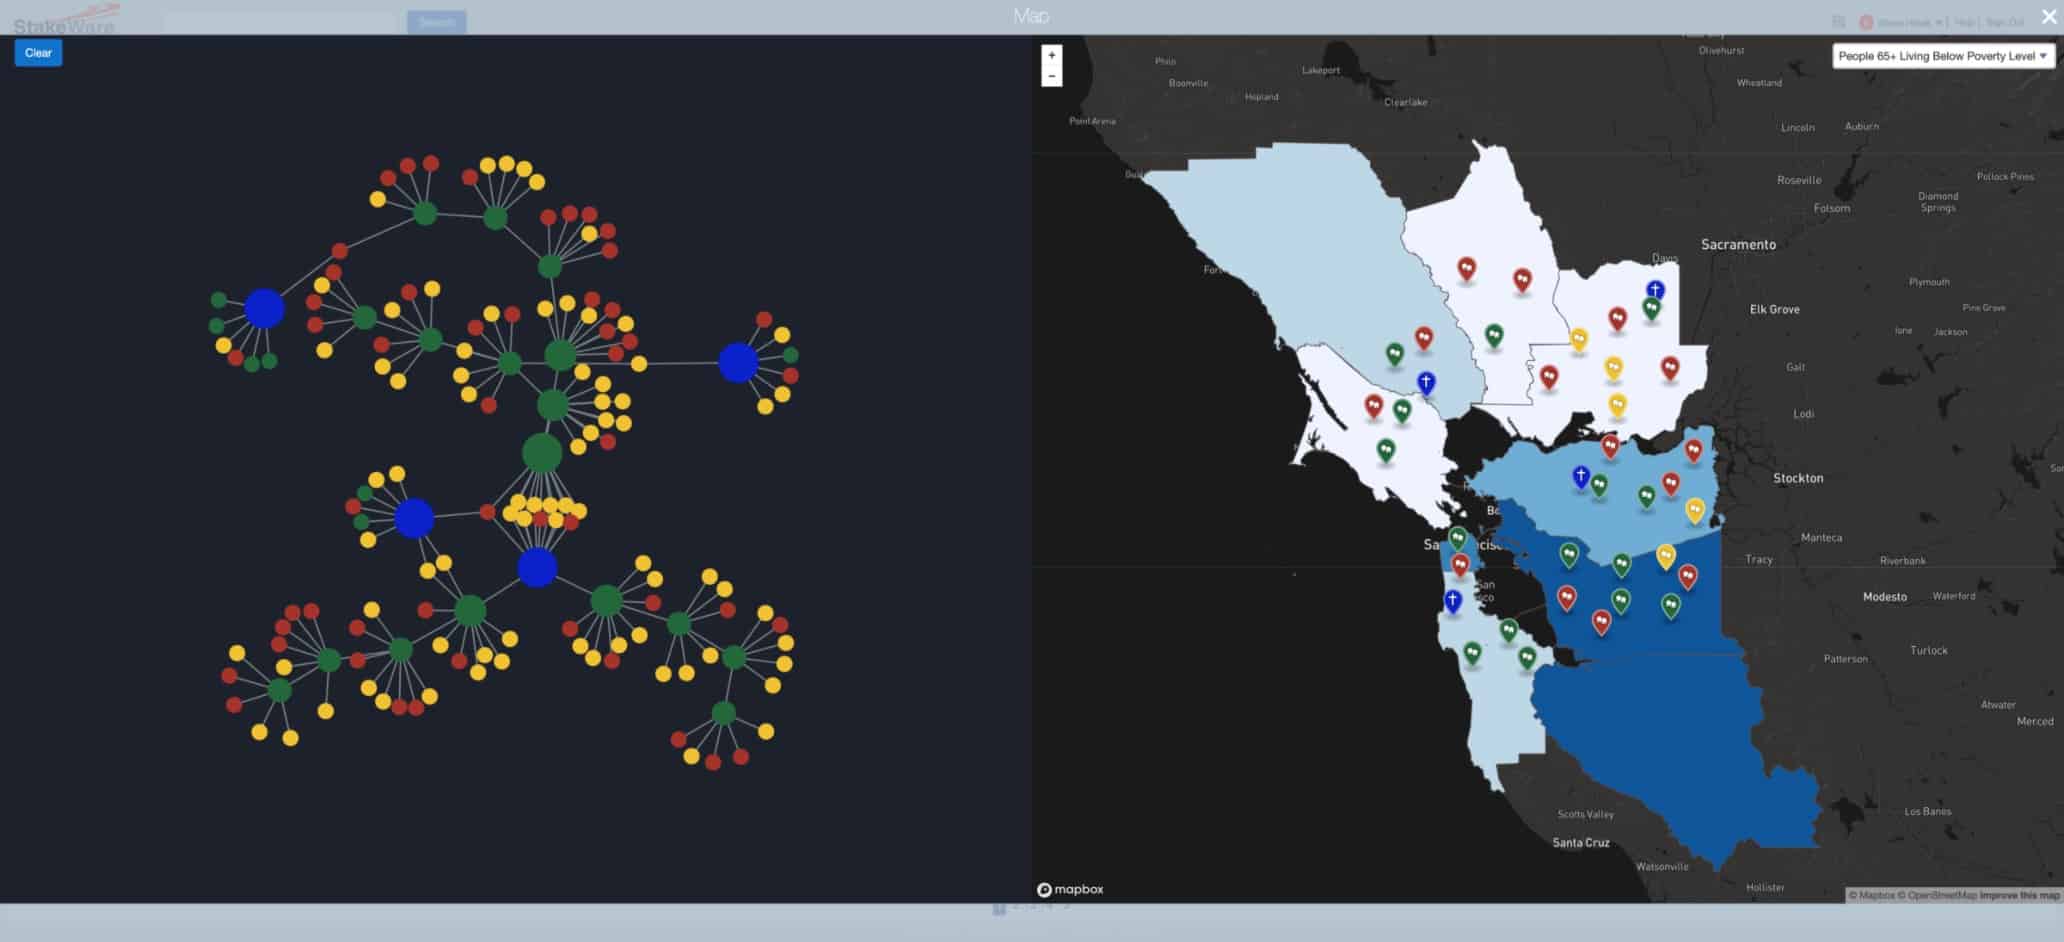
By taking sociodemographic data into account, we can create monitoring systems capable of allocating resources more effectively. The key is to be able to do this process at scale and in near real-time. For example, if we look at the problem from the perspective of counties with the highest population of people 65+ Living Below Poverty Level, then we might make different decisions regarding the kinds of thresholds that should trigger a more aggressive response.

Relationship Between a Network of Contacts, Organizations and Geographic and Economic Disparities

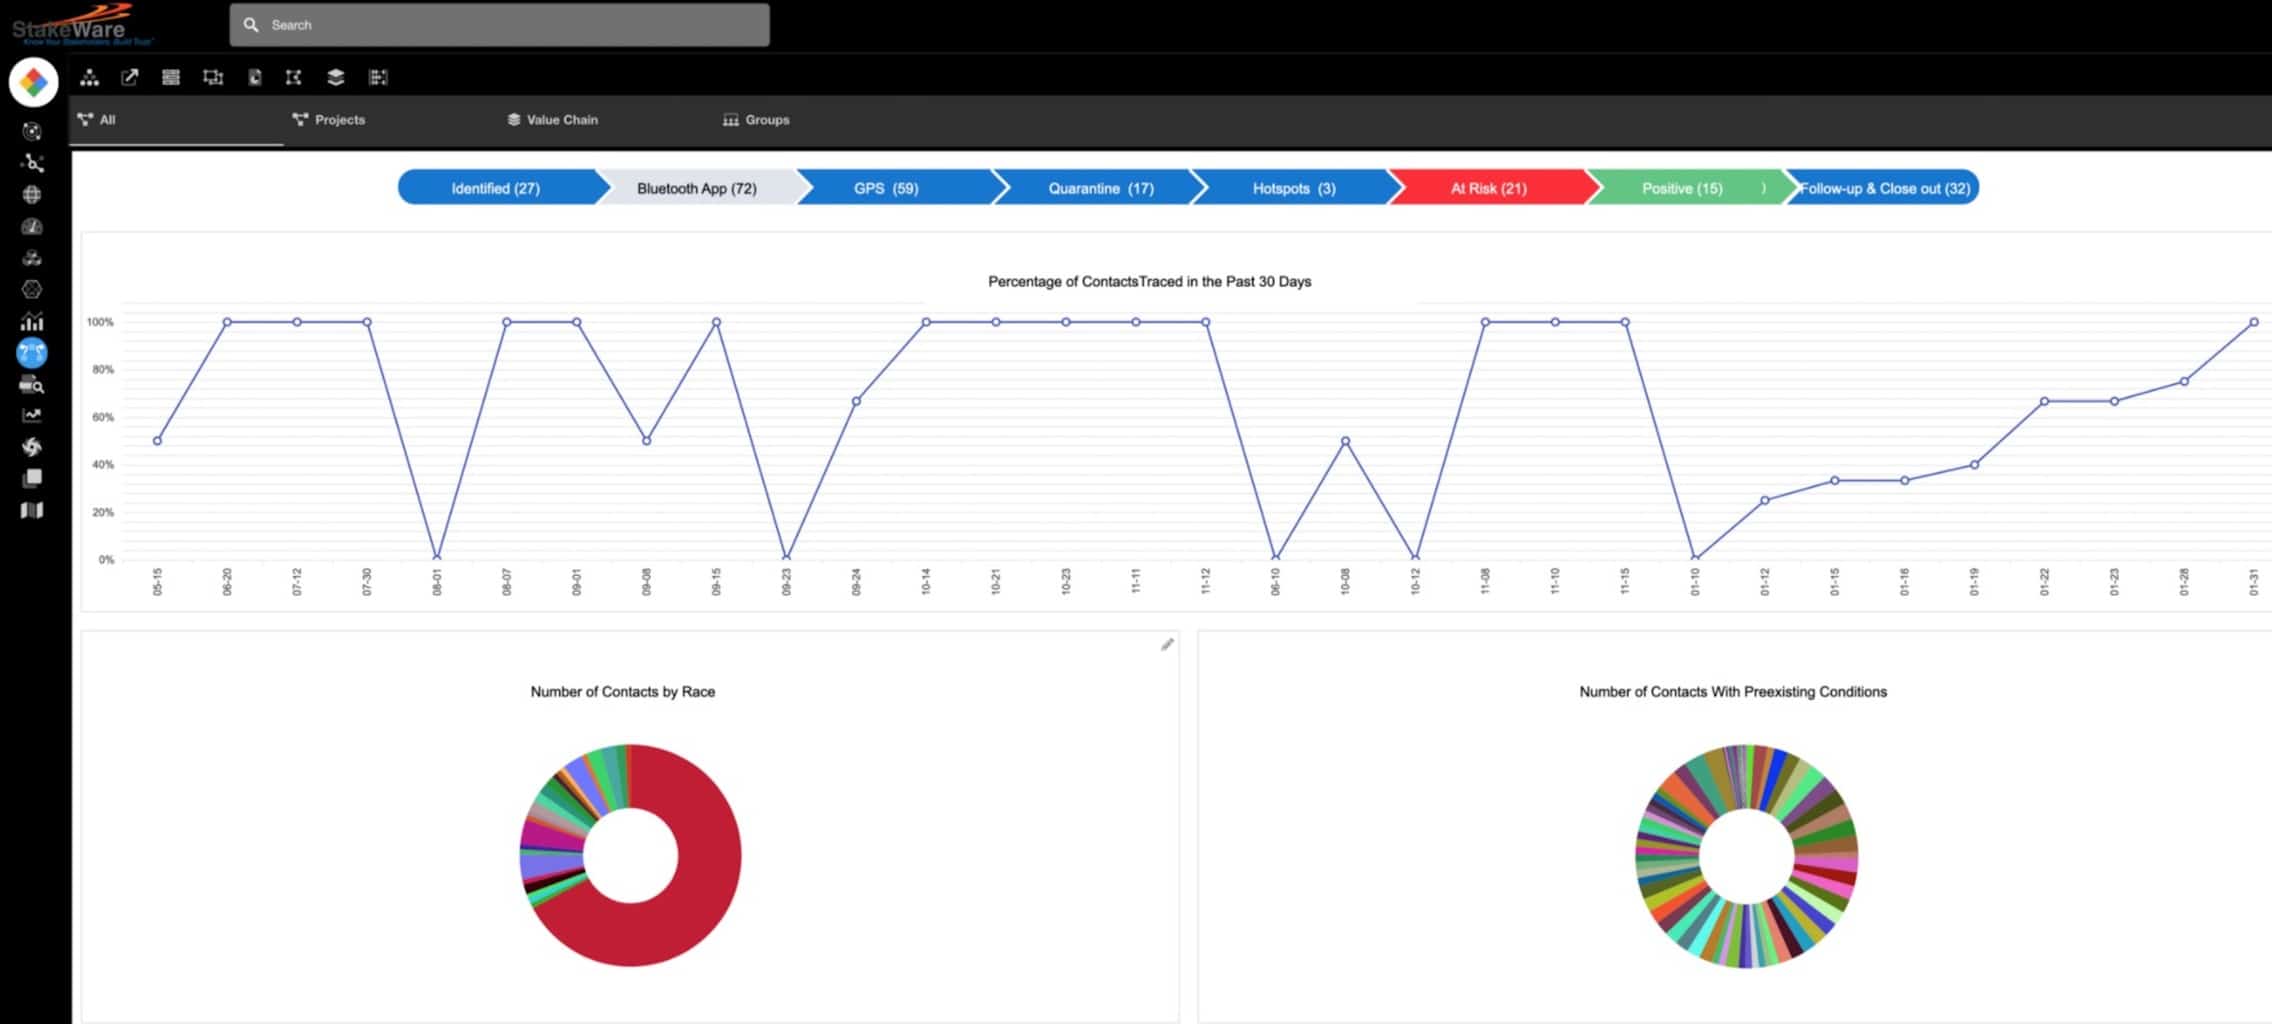
By having a more tailored approach, leaders can build trust with the community because they can address their most salient health and socioeconomic concerns in a proactive fashion. The following screen shows how an automated monitoring system helps the user rank contacts and take the appropriate actions during the 14 day incubation period of the COVID-19 virus. By implementing alerts and threshold notifications, the healthcare provider can log in to their system and immediately see the list of stakeholders to contact that day, prioritized by their order of importance according to the algorithm.

Automated Monitoring System 

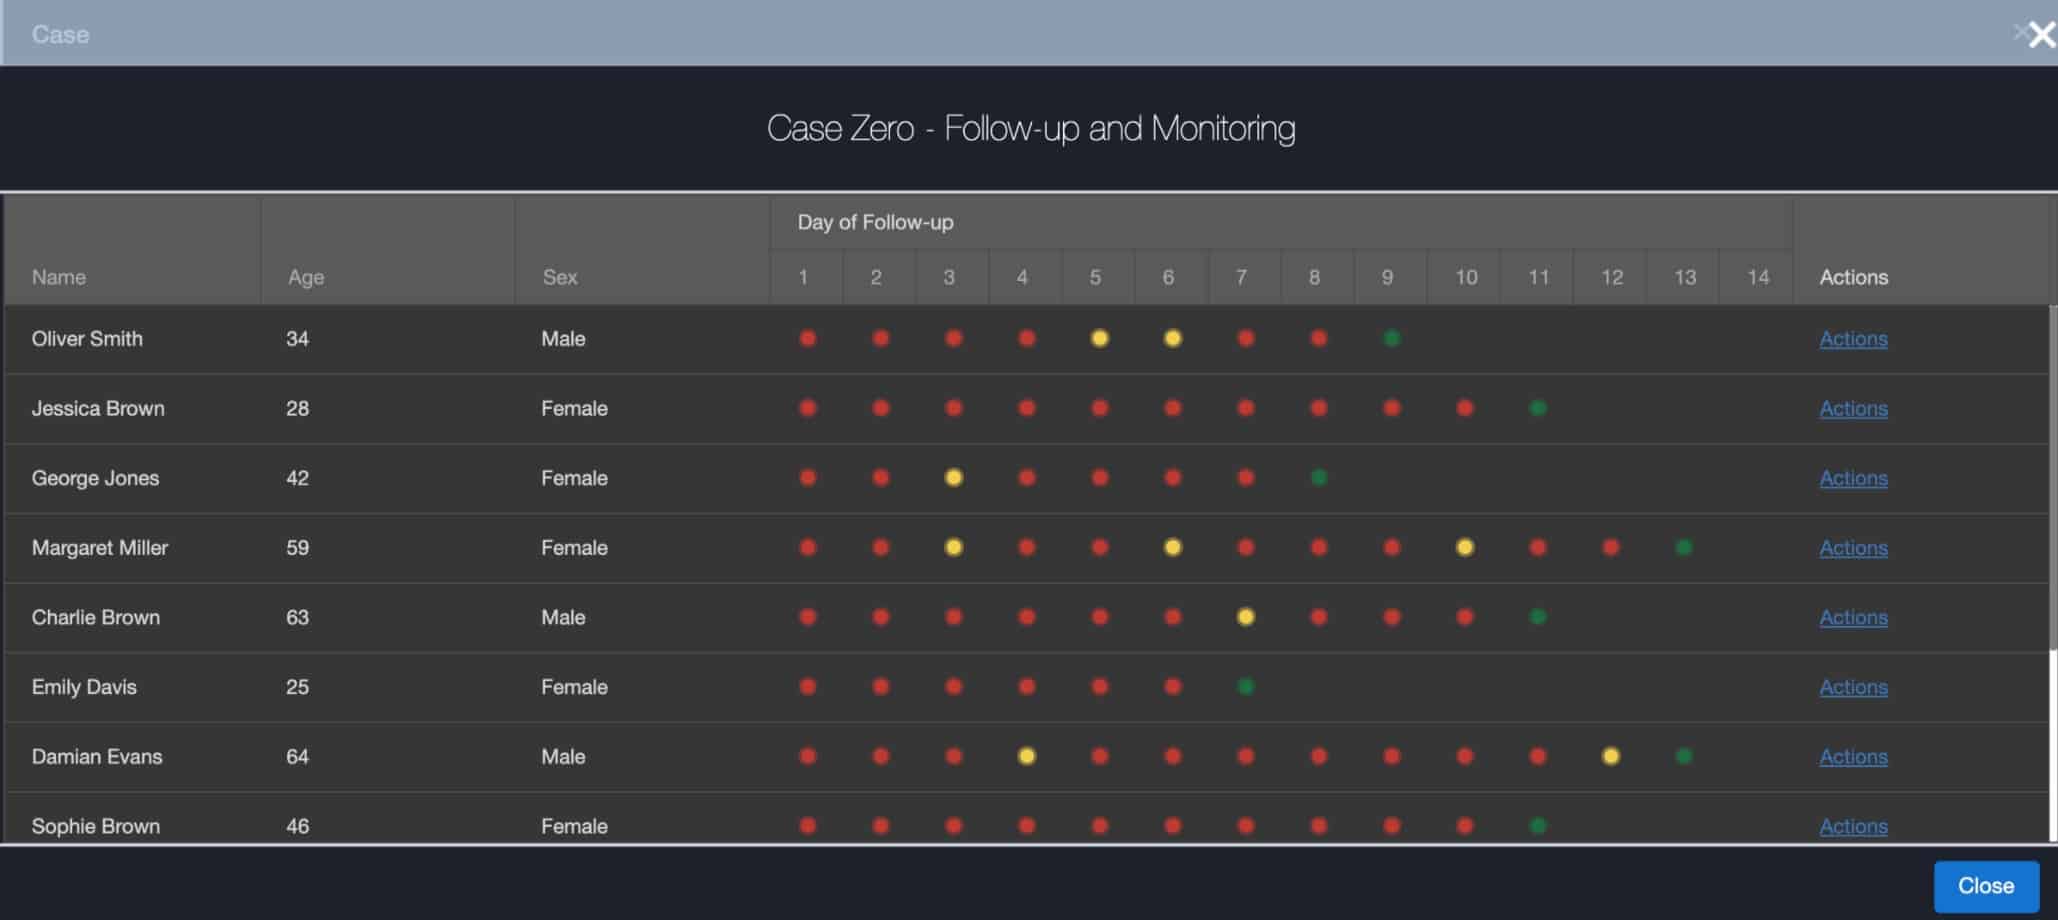
In this case, the algorithm ranks the contacts by sociodemographic, economic, and other risk factors, e.g., duration of exposure, proximity, and infectability. The goal is to find the next generation before it happens, getting ahead of that transmission cycle to stop it.

Conclusion: Using a multi-stakeholder model that considers sociodemographic data and racial disparities enables us to gain a deeper understanding of the situation at the local level. At the same time, we can take a thirty thousand foot view of the situation at a regional, state, and national level.

This dual capability enables us to address the impacts of geographic and socioeconomic disparities while strengthening vulnerabilities by balancing the receipt of health and economic relief. This holistic approach can lead to a framework for better decision-making and a more effective allocation of resources, enabling us to consider many dimensions of the relationship with a high degree of granularity and establish the appropriate level of risk and mitigating measures.

Risk Analysis for Case Zero

We propose that by creating a system built to increase trust, we can curtail the health impacts and maximize the economic benefits of reopening the economy smartly and equitably.

Key Performance Indicators Dashboard

In our next blog, we will explore how we can apply the same techniques to one of the other major societal issues of our times. How to bridge the trust gap in Police-Community Relations? We will demonstrate how a multi-stakeholder system designed to be an instrument of engagement and transparency can help build trust and increase stakeholder capital.

What is SRM – A Holistic Approach to Stakeholder Relationship Management

By | Uncategorized

SRM software is a critical component of any company’s success, but a competitive sailing yacht is only as good as its crew. A  company can have the best SRM system in the world, but has the team formalized a process? How about identifying its people and stakeholders? How do those people and processes interact to drive an organization to achieve its goals?

Now is the time to talk about the big picture of SRM as a holistic system to help drive success.

What Does SRM Stand For?

SRM is short for stakeholder relationship management, but it’s a whole lot more than those three basic words. It’s a combination of methodologies and software systems that help companies build relationships with stakeholders through organization, automation, synchronicity, and—most recently—collaboration. It ties together the stakeholder issue lifecycle and distributes it across the integrated teams and functions of your business.

SRM helps organizations be more effective and efficient in their day-to-day tasks and assists them in reaching long-term business objectives and goals. However, good process is nearly invisible. SRM must fit the organization’s processes, which are in turn driven by the stakeholder issue lifecycle.

The Three Pillars of SRM

People, process, and technology are each a critical cornerstone of a successful stakeholder relationship management strategy. Not giving proper attention to each will make those pillars crumble and your structure fall. Don’t fall prey to cognitive bias—the assumption there are no problems because the process already seems to work from your vantage point, or the assumption your people are already aware of the process. Ensure your process is in place and account for the people involved in your organization before selecting the right technology solution.

SRM maturity models can help organizations plan for their SRM roadmap and understand where they are in the process for full SRM mastery. A number of models exist, from the simple to the complex. Here is a simplified version to illustrate how organizations may be tempted to skip the people and process components of SRM strategy and head directly to technology.


today

Each stage represents a step along the SRM adoption continuum. Stage zero represents no process, while stage five is the highest level of fully integrated organizational actualization, a deep understanding of processes, use, and continuous improvement beyond just using the software.

Don’t get stuck in stage two or three on your organizational path to self-actualization. Understanding the people and processes behind your technology will keep things moving along.

People

SRM is all about the people—literally. Few other business functions are as focused on people. The origin of the practice is as old as business itself. After all, every business has relationships to manage. It’s just a matter of how technology has altered the speed and ways in which we connect. Businesses invest in SRM because they believe in building trust through long-term relationships.

The focus of SRM is to develop stronger stakeholder relationships, those lasting ties that help both the business and the stakeholder thrive. It’s essential to understand the stakeholder through profiles, use cases, needs, and issue lifecycle.

SRM systems help manage relationships with stakeholders—both internal and external—of your organization. These include:

  • Customers
  • Employees
  • Executive leadership
  • Partners
  • Suppliers
  • Media
  • Investors
  • Advisors
  • Communities
  • Activists
  • Government
  • NGO’s
  • Academia

The relationships between and among these stakeholders are key. Understanding what information needs to be shared and accessed by each party, as well as how information travels between them, will help guide a plan for SRM software. Consider building an organizational relationship map to identify critical paths in communication.

Process

Process is the structure that liberates your company to grow and evolve, and each process is unique to every organization.

Take your organizational relationship map and understand who will be using an SRM system. Know what their natural process is before investing in software. One core process that most business functions revolve around is the stakeholder issue lifecycle.

SRM Addresses the Issue Management Process

Stakeholder relationship management’s primary roles of CSR, External Affairs, HSE, Risk Management, Investor relations, represent functions along the stakeholder issue lifecycle. Although each has a dominant role, all work to support one another.

Every business’s  issue management process is unique, but a general flow according to John Bryson and Archie Carroll is as follows:


27

So how does each stakeholder relationship management function address these core lifecycle events? Here are a few ways the functions work together and address each step.

Identification

  • Stakeholder and issue identification by scanning and monitoring various sources, such as social media, hotlines, activist campaigns, direct requests for information, internal or external research, publications, grievance mechanism, expert analysis etc.
  • Determine the type of issues and where they are in their lifecycle.
  • Consideration of the impact the issues might have on the company or its divisions.

Analysis

  • CSR department coordinates engagement between the company and stakeholder to learn more about the issues or grievances.
  • Internal coordination to determine the probable impact on the company or its divisions as precisely as possible.

Ranking or prioritizing of issues

  • CSR department coordinates the prioritization process with other departments i.e. Public Affairs, CSR, HSE, Investor Relations
  • Company determines the risk and opportunities associated with priority issues.

Formulating issue response

  • Company creates a strategic response and defines the content of the message.
  • CSR engages to communicate response and answer additional questions.

Implementing issue response

  • CSR communicates the response effectively with each target group in a credible form.
  • CSR follows up with next steps, if necessary.

Monitoring and evaluating issue response

  • Identification of key performance indicators and evaluation of results.
  • Evaluate the success of policies and programs to determine future strategies.
  • Capture lessons from failures and successes.

Measurement

What gets measured gets managed, even in stakeholder relationships. Metrics and key performance indicators can both drive process and be driven by process. Data collection may reveal a new process requirement, and processes deliver these metrics.

Metrics will change from organization to organization. Get ready to step back to the beginning to get it just right. Here are three adoption metrics to look out for:

  1. Usage: The first basic indicator of success is login rates. Ensure users are consistently updating data, creating new stakeholder profiles. On a weekly basis, keep an eye on the number of users logged in on a weekly basis (as well as those who never logged in). On a monthly basis, focus on new stakeholders and issues created.
  2. Data quality: Check that users fill out fields correctly or incorrectly. Look out for stakeholder profiles missing certain fields, as well as those with all fields populated.
  3. Business performance: Make sure users are actually using SRM software to enhance business effectiveness. It’s also a good idea to build analytics that can uncover trends and patterns on performance (and in turn, identify any trouble areas).

Defining these metrics ahead of time based on organizational goals and functions will produce a stronger, clearer vision of the best SRM software for your organization.

Technology

As technology has improved over the last couple decades and become more accessible (thanks to Internet-based software), businesses now have access to powerful, comprehensive, and affordable SRM systems.

Now that we’ve walked through people and process, it’s time to consider a technology solution. Selecting SRM software comes down to a variety of factors. Here’s what to ask at the start of your search:

  1. Business objectives: What are your core values? What are your business objectives? This drives the intent of your SRM system.
  2. People: Who will need access to the data? What are their requirements?
  3. Process: How does this fit into the larger process among the key functions of CSR, HSE, Public Affairs, Risk Management, and beyond?
  4. Budget: How is this solution priced? Is it per seat or a flat monthly fee? What additional services will need to factor into acquiring this new software (training, IT upgrades, warranties, etc.)?
  5. Ease of use: How easily will your team be able to adopt this software?
  6. Compatibility: Is this SRM software compatible with your current IT infrastructure? Can it access the API of third-party systems? Is it compatible with mobile devices? Is it cloud-based or an on-premise implementation?
  7. Growth: Is there opportunity for expansion as your company and needs grow?
  8. Measurement: What do you need to measure and track? How is this data communicated in the software?

The best SRM software turns data and information into actionable insights. Here is a selection of functions your organization may need access to:

  • Stakeholder web tracking: Helps show the cycle and movement of the stakeholder issues
  • Email automation: Sends emails automatically, triggered by a variety of events
  • File management: Sharing among employees in one location
  • Interaction tracking: Not only educates different departments on activity but it can also shred light on effectiveness of engagement.
  • Knowledge base: Updated by all users as a central repository for knowledge exchange

Protecting One of the Largest Assets: Your Data

Your SRM system is the bank where a vast amount of sensitive information is stored. If the technology isn’t buttoned up it’s easy for information to slip through the cracks due to day-to-day activity.

recent study reveals that recovery from a data breach costs an average of $14 million per company. Understanding how specific SRM technology protects against both internal and external security breaches will save an organization money, guard against adverse public relations, and, most importantly, protect your stakeholders.

Don’t Forget Security

External security is often top of mind when news stories break about hackers walking away with a cache of credit card information from major retailers. However, external factors rank very small on the percent of all data leaks. Only 4 percent are due to hacking and a minute 2 percent are attributed to natural disasters such as fires and floods.

It’s important to address those external threats with high-security infrastructure. Consider a multi-layered security approach to significantly reduce the risk of a breach and define your roles and permissions ahead of selecting SRM software.

That being said, cloud-based security is a safe and reliable route to go. Because cloud systems have far more computing power than traditional software, they can examine files nearly instantly, meaning security problems are often resolved faster than traditional software systems. Web security can also create a layered approach, which translates to additional protection overall.

Planning for New Channels

Revisit your stakeholder issue lifecycle and internal process. Where do your stakeholders access technology? How is this behaviour projected to change in the coming years? How does your internal team prefer to access their data?

SRM users  prefer to access their software from laptops  and desktop computers. The hypothesis is that CSR field representatives prefer to access as they travel, which may explain why SRM access from smartphones  and tablets is on the rise. Industry analyst Brian Vellmure says, “The knowledge worker of today and certainly [of] the future will expect to use, and interact seamlessly on, all of their devices, depending on the context.”

Conclusion

SRM is not just software. It’s a holistic approach to a lasting relationship with your stakeholders. Set your people and process in place before selecting the technology for the right fit. Once your technology is in place, support it and the evolving needs of your people and process.

The most important factor of a stakeholder relationship management practice is human connection. SRM software should enhance individual experiences and personalize touch points, not be a roadblock to creating the emotional bond necessary for long-term sustainability.